South African National Land Cover (SANLC)#
Product description#
The South African National Land Cover (SANLC) product available in the SALDi Data Cube (SDC) has been acquired from the Department of Forest, Fisheries and the Environment of the Republic of South Africa.
The product abbreviation used in this package is sanlc.
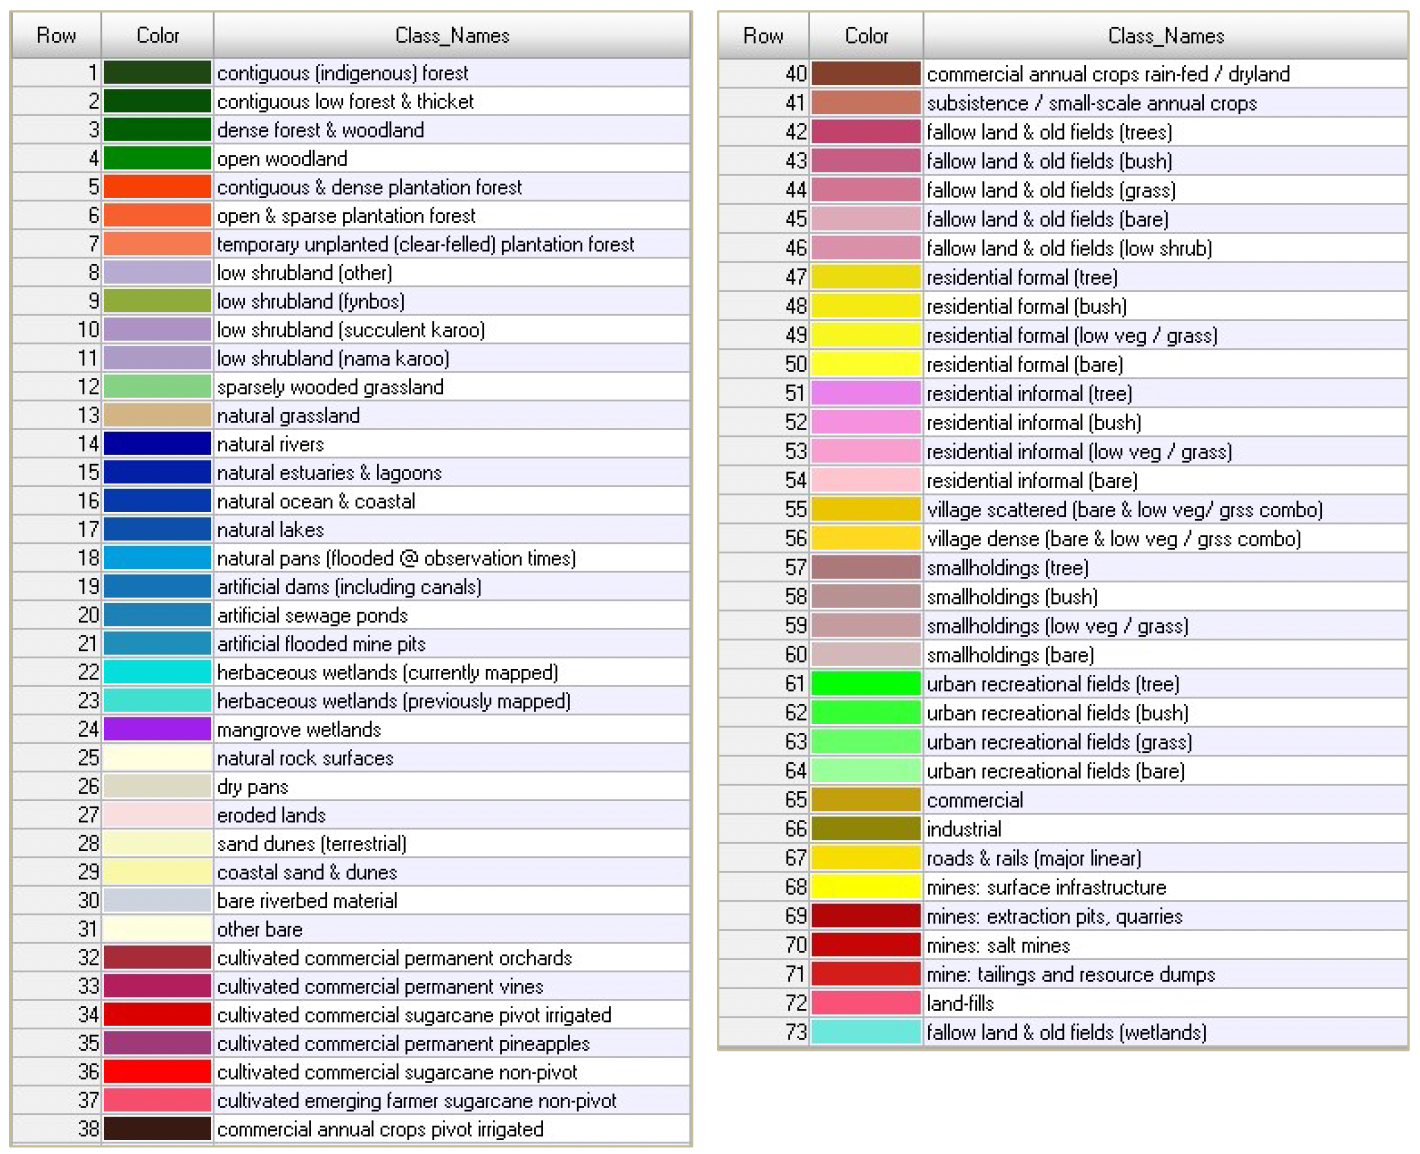
The following table shows the classes of the 2020 SANLC product. Please note that classification schemes may vary between years. Reports and color palettes are available on the website mentioned above.

Source: Thompson, M., 2021, “2020 SANLC Technical Presentation”, Presentation to the South African National Land Cover Data Users 2020 SANLC Data Launch
Import packages#
%matplotlib inline
from sdc.load import load_product
Loading data#
The product is currently available for the years 2018, 2020 and 2022. A special parameter
sanlc_year of the load_product-function can be used to select the year of interest:
lc2022 = load_product(product="sanlc",
                      vec="site06",
                      sanlc_year=2022)
lc2022
<xarray.DataArray 'asset' (latitude: 5500, longitude: 6500)> Size: 36MB
dask.array<getitem, shape=(5500, 6500), dtype=uint8, chunksize=(5500, 6500), chunktype=numpy.ndarray>
Coordinates:
  * latitude     (latitude) float64 44kB -24.9 -24.9 -24.9 ... -26.0 -26.0 -26.0
  * longitude    (longitude) float64 52kB 30.75 30.75 30.75 ... 32.05 32.05
    spatial_ref  int32 4B 4326
    time         datetime64[ns] 8B 2022-01-01
Attributes:
nodata: 0If the sanlc_year-parameter is not defined, the default value None is used and all
available years will be loaded:
lc_all = load_product(product="sanlc", vec="site06")
lc_all
<xarray.DataArray 'asset' (time: 3, latitude: 5500, longitude: 6500)> Size: 107MB
dask.array<asset, shape=(3, 5500, 6500), dtype=uint8, chunksize=(3, 5500, 6500), chunktype=numpy.ndarray>
Coordinates:
  * latitude     (latitude) float64 44kB -24.9 -24.9 -24.9 ... -26.0 -26.0 -26.0
  * longitude    (longitude) float64 52kB 30.75 30.75 30.75 ... 32.05 32.05
    spatial_ref  int32 4B 4326
  * time         (time) datetime64[ns] 24B 2018-01-01 2020-01-01 2022-01-01
Attributes:
nodata: 0Xarray Shorts: Creating and applying a boolean mask#
The SANLC product can be used to create a boolean mask, which can be applied to
other datasets to extract only the pixels that are of interest. Xarray’s
isin-method
makes this very easy. Just pass the values you want to keep as a list to the
method and it will return a boolean mask.
classes = [3, 4]
mask = lc2022.isin(classes)
mask
<xarray.DataArray 'asset' (latitude: 5500, longitude: 6500)> Size: 36MB
dask.array<any-aggregate, shape=(5500, 6500), dtype=bool, chunksize=(5500, 6500), chunktype=numpy.ndarray>
Coordinates:
  * latitude     (latitude) float64 44kB -24.9 -24.9 -24.9 ... -26.0 -26.0 -26.0
  * longitude    (longitude) float64 52kB 30.75 30.75 30.75 ... 32.05 32.05
    spatial_ref  int32 4B 4326
    time         datetime64[ns] 8B 2022-01-01
Attributes:
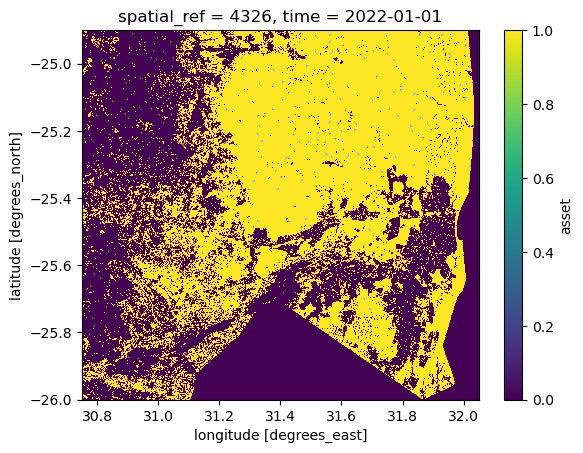
nodata: 0A boolean mask is a binary array filled with 1s and 0s. The 1s indicate the pixels that are of interest, the 0s the pixels that are not:
mask.plot()
<matplotlib.collections.QuadMesh at 0x7fd48fa4d910>

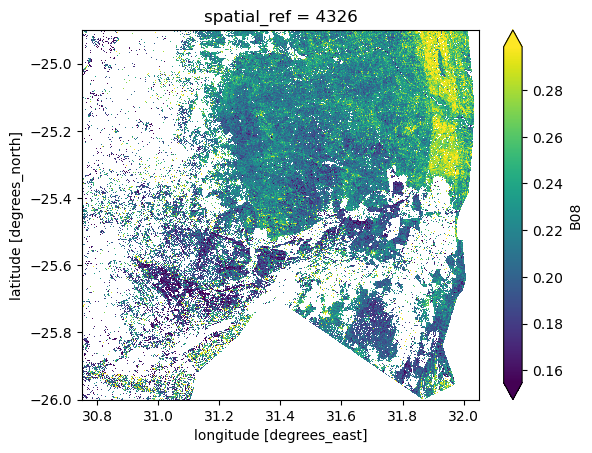
Let’s apply this mask to a Sentinel-2 dataset and plot the per-pixel mean of the
B08-band (NIR):
s2 = load_product(product="s2_l2a",
                  vec="site06",
                  time_range=("2022-06-01", "2022-08-01"))

s2_masked = s2.where(mask)
[WARNING] Loading data for an entire SALDi site will likely result in performance issues as it will load data from multiple tiles. Only do so if you know what you are doing and have optimized your workflow! It is recommended to start with a small subset to test your workflow before scaling up.
s2_masked.B08.mean(dim="time").plot(robust=True)
<matplotlib.collections.QuadMesh at 0x7fd4847c5dc0>

As expected, the mask has been applied to the dataset and only the pixels that
are of interest are left. The rest has been set to NaN.
In this example, we aggregated the temporal dimension by calculating per-pixel mean values. To create a time series of spatially aggregated values, apply the aggregation function (e.g., mean, median, standard deviation) over the spatial dimensions instead. Be sure to select individual SANLC classes so that each resulting time series represents a particular class.
