Sentinel-1 Surface Moisture Index (SurfMI)#
Product description#
The Sentinel-1 Surface Moisture Index (SurfMI) is derived from the Sentinel-1 RTC product. It is a measure of the relative surface moisture, based on the assumption that short-term variations of the radar backscatter signal are associated with moisture variations, while long-term changes can be related to vegetation and surface roughness. The SurfMI \(m_s(t)\) is calculated as:
where \(\sigma^0(t)\) is a backscatter time series, \(\sigma_{dry}^0(t)\) the dry reference (permanent wilting level) and \(\sigma_{wet}^0(t)\) the wet reference (field capacity) (Urban et al., 2018). For the dry and wet references, the 5th and 95th percentile of the backscatter time series are used, respectively. These layers have been pre-computed for each SALDi site based on the available Sentinel-1 RTC VV-polarised backscatter data so that the SurfMI can be efficiently calculated on the fly.
The product abbreviation used in this package is s1_surfmi.
Import packages#
%matplotlib inline
from matplotlib import pyplot as plt
import fiona
from sdc.load import load_product
Loading data#
vec = '../../_assets/vec_01_05_01.geojson'
time_range=("2018-01-01", "2023-01-01")
ds = load_product(product="s1_surfmi", vec=vec, time_range=time_range)
ds
<xarray.DataArray (time: 385, latitude: 131, longitude: 147)>
dask.array<where, shape=(385, 131, 147), dtype=float32, chunksize=(385, 131, 147), chunktype=numpy.ndarray>
Coordinates:
  * latitude     (latitude) float64 -25.06 -25.06 -25.06 ... -25.08 -25.08
  * longitude    (longitude) float64 31.47 31.47 31.47 31.47 ... 31.5 31.5 31.5
    spatial_ref  int32 4326
  * time         (time) datetime64[ns] 2018-01-03T16:30:28.531898 ... 2022-12...
Attributes:
    dry_reference:  site06_vv_q05__20180103T163028_20230903T163910.tif
wet_reference: site06_vv_q95__20180103T163028_20230903T163910.tifComparison with precipitation data#
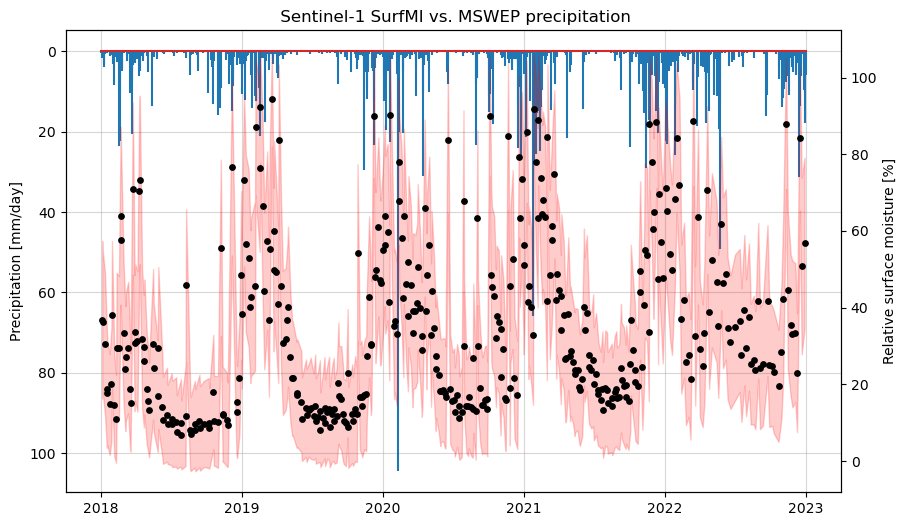
Let’s compare the SurfMI with the mswep precipitation data. Instead of loading this product using the same vector file as above, we will load it for the entire SALDi site and then select the central coordinate of the vector file. This is a workaround for this issue, which results in an empty DataArray if the area of interest is smaller than a single pixel of the MSWEP product.
# Load MSWEP data
mswep = load_product(product="mswep", vec="site06", time_range=time_range)

# Get the center coordinate of the vector file
with fiona.open(vec) as src:
    bounds = src.bounds
    lon = (bounds[0] + bounds[2]) / 2
    lat = (bounds[1] + bounds[3]) / 2

# Select the nearest grid point to the center coordinate
mswep_pt = mswep.sel(latitude=lat, longitude=lon, method='nearest')
mswep_pt
<xarray.DataArray 'precipitation' (time: 1825)>
array([ 0.375    ,  1.6875   ,  0.       , ...,  2.7890625, 17.882812 ,
        6.015625 ], dtype=float32)
Coordinates:
  * time         (time) datetime64[ns] 2018-01-01 2018-01-02 ... 2022-12-31
    longitude    float32 31.45
    latitude     float32 -25.05
    spatial_ref  int32 4326
Attributes:
units: mm d-1For the plot we calculate the mean and standard deviation for each time step of the SurfMI data by aggregating over the spatial dimensions (latitude and longitude):
ds_mean = ds.mean(dim=['latitude', 'longitude'])
ds_std = ds.std(dim=['latitude', 'longitude'])

ds_mean
<xarray.DataArray (time: 385)>
dask.array<mean_agg-aggregate, shape=(385,), dtype=float32, chunksize=(385,), chunktype=numpy.ndarray>
Coordinates:
    spatial_ref  int32 4326
  * time         (time) datetime64[ns] 2018-01-03T16:30:28.531898 ... 2022-12...
Attributes:
    dry_reference:  site06_vv_q05__20180103T163028_20230903T163910.tif
wet_reference: site06_vv_q95__20180103T163028_20230903T163910.tiffig, ax = plt.subplots(figsize=(10, 6))
ax.stem(mswep_pt.time, mswep_pt, markerfmt="")
ax.grid(True, alpha=0.5)
ax.set_ylabel("Precipitation [mm/day]")
ax.invert_yaxis()
ax2 = ax.twinx()
ax2.fill_between(ds_mean.time, ds_mean - ds_std, ds_mean + ds_std, color='red', alpha=0.2)
ax2.scatter(ds_mean.time, ds_mean, color='black', s=15)
ax2.set_ylabel("Relative surface moisture [%]")
plt.xlabel("Time")
plt.title(" Sentinel-1 SurfMI vs. MSWEP precipitation")
Text(0.5, 1.0, ' Sentinel-1 SurfMI vs. MSWEP precipitation')

