…calculate indices using the spyndex package?#
spyndex is an awesome package that let’s you calculate a wide range of spectral
indices accessed from the curated Awesome Spectral Indices
list, which contains an overview of spectral indices, their formulas and their
respective references. The spyndex package might already be included in your
environment if you have used a recent version of the environment.yml file provided
in the sdc-tools repository. If not, follow the installation instructions
to install it.
The documentation of the spyndex package provides an overview of its functionality
as well as more specific tutorials.
This notebook section will only cover a short example on how to use it in the context of
the Sentinel-2 L2A data product provided via the sdc_tools package.
Let’s start by importing the package and displaying an overview of two commonly used vegetation indices:
import spyndex

spyndex.indices.NDVI
SpectralIndex(NDVI: Normalized Difference Vegetation Index)
        * Application Domain: vegetation
        * Bands/Parameters: ['N', 'R']
        * Formula: (N-R)/(N+R)
        * Reference: https://ntrs.nasa.gov/citations/19740022614
spyndex.indices.EVI
SpectralIndex(EVI: Enhanced Vegetation Index)
        * Application Domain: vegetation
        * Bands/Parameters: ['g', 'N', 'R', 'C1', 'C2', 'B', 'L']
        * Formula: g*(N-R)/(N+C1*R-C2*B+L)
        * Reference: https://doi.org/10.1016/S0034-4257(96)00112-5
The information provided is very helpful! In addition to spectral bands, the EVI also
includes some constants. Let’s use list comprehension
to separate bands from constants so that we get a better understanding of which bands of
our Sentinel-2 L2A xarray.Dataset we need to provide to calculate the index:
evi_bands = [b for b in spyndex.indices.EVI.bands if b
             not in spyndex.constants]
evi_bands
['N', 'R', 'B']
evi_constants = [b for b in spyndex.indices.EVI.bands if b
                 in spyndex.constants]
evi_constants
['g', 'C1', 'C2', 'L']
You can get further information on specific constants (and their default value) and bands:
spyndex.constants.C1
Constant(C1: Coefficient 1 for the aerosol resistance term)
        * Default value: 6.0
spyndex.bands.N
Band(N: Near-Infrared (NIR))
Tip
This table
is very useful to find the corresponding sensor band name for each spectral band.
For example, the corresponding Sentinel-2 band for NIR is B08.
The main function to calculate spectral indices is spyndex.computeIndex,
which requires an index name or a list of index names (parameter: index) that you want
to calculate as well as a dictionary that maps the spectral bands with the corresponding
sensor band names (parameter: params).
Sounds more complicated than it is. Let’s calculate both indices (NDVI and EVI) for the
same Sentinel-2 L2A dataset using the 'N' (NIR / B08) , 'R' (Red / B04) and 'B'
(Blue / B02) bands common to both indices while leaving the EVI constants at their
default values:
from sdc.load import load_product

ds = load_product(product='s2_l2a', vec=vec,
                  time_range=("2020-01-01", "2021-01-01"))
ds.B11
<xarray.DataArray 'B11' (time: 231, latitude: 628, longitude: 927)> Size: 538MB
dask.array<rechunk-p2p, shape=(231, 628, 927), dtype=float32, chunksize=(231, 313, 463), chunktype=numpy.ndarray>
Coordinates:
  * latitude     (latitude) float64 5kB -34.08 -34.08 -34.08 ... -34.21 -34.21
  * longitude    (longitude) float64 7kB 19.95 19.95 19.95 ... 20.13 20.13 20.13
    spatial_ref  int32 4B 4326
  * time         (time) datetime64[ns] 2kB 2020-01-01T08:49:41 ... 2020-12-31...
Attributes:
nodata: 0params = {'N': ds.B08,
'R': ds.B04,
'B': ds.B02}
ds_indices = spyndex.computeIndex(index=['NDVI', 'EVI'],
params=params)
ds_indices
---------------------------------------------------------------------------
Exception                                 Traceback (most recent call last)
Cell In[11], line 5
      1 params = {'N': ds.B08,
      2           'R': ds.B04,
      3           'B': ds.B02}
----> 5 ds_indices = spyndex.computeIndex(index=['NDVI', 'EVI'],
      6                                   params=params)
      7 ds_indices

File ~/micromamba/envs/dev_sdc_env/lib/python3.12/site-packages/spyndex/spyndex.py:221, in computeIndex(index, params, online, returnOrigin, coordinate, **kwargs)
    219         raise Exception(f"{idx} is not a valid Spectral Index!")
    220     else:
--> 221         _check_params(idx, params, indices)
    222         result.append(eval(indices[idx]["formula"], {}, params))
    224 if len(result) == 1:

File ~/micromamba/envs/dev_sdc_env/lib/python3.12/site-packages/spyndex/utils.py:74, in _check_params(index, params, indices)
     72 for band in indices[index]["bands"]:
     73     if band not in list(params.keys()):
---> 74         raise Exception(
     75             f"'{band}' is missing in the parameters for {index} computation!"
     76         )

Exception: 'g' is missing in the parameters for EVI computation!
Whoops… that didn’t work. Seems like the easy way to use default values of the constants is not an option. The reason is explained in this issue by the author of the package. Be careful of blindly using default values and do your own research to decide on the best values for your use case! Some constants might need to be adjusted depending on the sensor used or the type of vegetation you are looking at.
For this example, however, we will just use the default values and try again:
for c in evi_constants:
    print(spyndex.constants[c])
g: Gain factor
        * Default value: 2.5

C1: Coefficient 1 for the aerosol resistance term
        * Default value: 6.0

C2: Coefficient 2 for the aerosol resistance term
        * Default value: 7.5

L: Canopy background adjustment
        * Default value: 1.0
params = {'N': ds.B08,
          'R': ds.B04,
          'B': ds.B02,
          'g': 2.5,
          'C1': 6.0,
          'C2': 7.5,
          'L': 1.0}

ds_indices = spyndex.computeIndex(index=['NDVI', 'EVI'],
                                  params=params)
ds_indices
<xarray.DataArray (index: 2, time: 231, latitude: 628, longitude: 927)> Size: 1GB
dask.array<concatenate, shape=(2, 231, 628, 927), dtype=float32, chunksize=(1, 231, 313, 463), chunktype=numpy.ndarray>
Coordinates:
  * latitude   (latitude) float64 5kB -34.08 -34.08 -34.08 ... -34.21 -34.21
  * longitude  (longitude) float64 7kB 19.95 19.95 19.95 ... 20.13 20.13 20.13
  * time       (time) datetime64[ns] 2kB 2020-01-01T08:49:41 ... 2020-12-31T0...
  * index      (index) <U4 32B 'NDVI' 'EVI'
Attributes:
nodata: 0This new DataArray comes with a dimension called index. You can use the
.sel-method
to select a specific index:
evi = ds_indices.sel(index='EVI')
ndvi = ds_indices.sel(index='NDVI')
ndvi
<xarray.DataArray (time: 231, latitude: 628, longitude: 927)> Size: 538MB
dask.array<getitem, shape=(231, 628, 927), dtype=float32, chunksize=(231, 313, 463), chunktype=numpy.ndarray>
Coordinates:
  * latitude   (latitude) float64 5kB -34.08 -34.08 -34.08 ... -34.21 -34.21
  * longitude  (longitude) float64 7kB 19.95 19.95 19.95 ... 20.13 20.13 20.13
  * time       (time) datetime64[ns] 2kB 2020-01-01T08:49:41 ... 2020-12-31T0...
    index      <U4 16B 'NDVI'
Attributes:
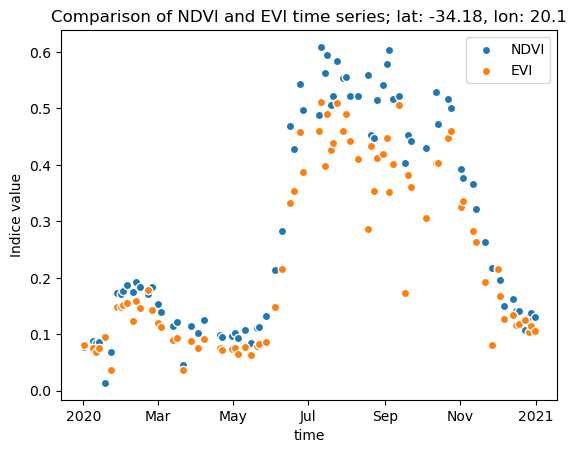
nodata: 0Let’s finish this topic with a simple scatterplot of the two indices for a random point in the area of interest:
import matplotlib.pyplot as plt

pt = (20.1, -34.18)
ndvi_pt = ndvi.sel(longitude=pt[0], latitude=pt[1], method="nearest")
evi_pt = evi.sel(longitude=pt[0], latitude=pt[1], method="nearest")

ndvi_pt.plot.scatter(x="time", label="NDVI")
evi_pt.plot.scatter(x="time", label="EVI")
plt.title(f"Comparison of NDVI and EVI time series; lat: {pt[1]}, lon: {pt[0]}")
plt.ylabel("Indice value")
plt.legend()
<matplotlib.legend.Legend at 0x7f4258350f20>

