Copernicus DEM GLO-30 (COP-DEM)#
Product description#
The Copernicus DEM GLO-30 data product available in the SALDi Data Cube (SDC) has been sourced from the Copernicus Contributing Missions Online platform.
Detailed information can be found here.
The product abbreviation used in this package is cop_dem
Import packages#
%matplotlib inline
from sdc.load import load_product
Loading data#
As no time series is available for this product, the load_data function only requires
the product and vec parameters:
ds = load_product(product="cop_dem", vec="site06")
ds
<xarray.Dataset>
Dimensions:      (latitude: 5500, longitude: 6500)
Coordinates:
  * latitude     (latitude) float64 -24.9 -24.9 -24.9 ... -26.0 -26.0 -26.0
  * longitude    (longitude) float64 30.75 30.75 30.75 ... 32.05 32.05 32.05
    spatial_ref  int32 4326
    time         datetime64[ns] 2019-10-19
Data variables:
    elevation    (latitude, longitude) float32 dask.array<chunksize=(5500, 6100), meta=np.ndarray>
    slope        (latitude, longitude) float32 nan nan nan 89.93 ... nan nan nan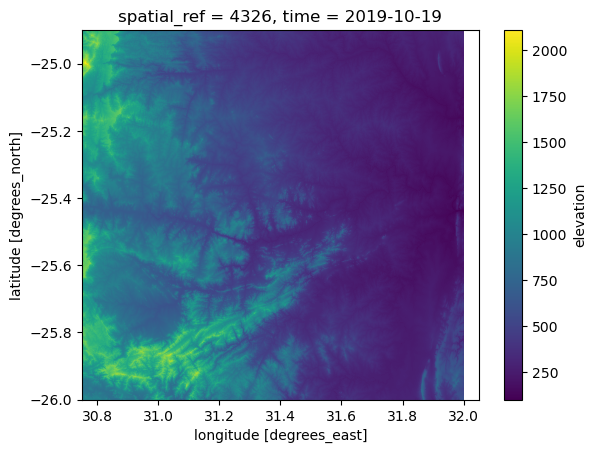
aspect (latitude, longitude) float32 nan nan nan 360.0 ... nan nan nanThe main variable of this product is called elevation, which is lazily loaded as you
can see below. Two additional variables are available: slope and aspect. These have
been computed during the loading process with the help of the xarray-spatial
package.
ds.elevation
<xarray.DataArray 'elevation' (latitude: 5500, longitude: 6500)>
dask.array<getitem, shape=(5500, 6500), dtype=float32, chunksize=(5500, 6100), chunktype=numpy.ndarray>
Coordinates:
* latitude (latitude) float64 -24.9 -24.9 -24.9 ... -26.0 -26.0 -26.0
* longitude (longitude) float64 30.75 30.75 30.75 ... 32.05 32.05 32.05
spatial_ref int32 4326
time datetime64[ns] 2019-10-19
Attributes:
_FillValue: -32767.0ds.elevation.plot()
<matplotlib.collections.QuadMesh at 0x7f40b76d5750>
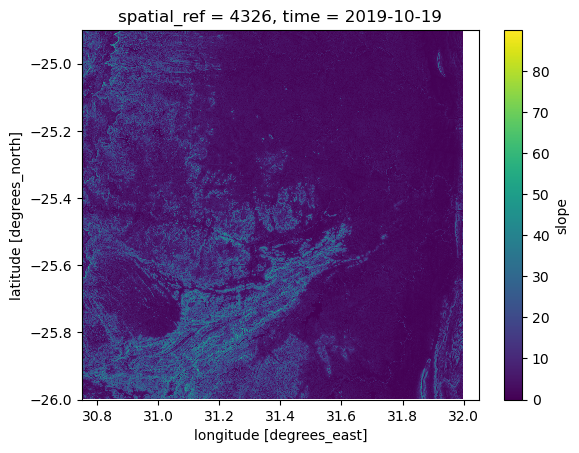
ds.slope
<xarray.DataArray 'slope' (latitude: 5500, longitude: 6500)>
array([[nan, nan, nan, ..., nan, nan, nan],
       [nan, nan, nan, ..., nan, nan, nan],
       [nan, nan, nan, ..., nan, nan, nan],
       ...,
       [nan, nan, nan, ..., nan, nan, nan],
       [nan, nan, nan, ..., nan, nan, nan],
       [nan, nan, nan, ..., nan, nan, nan]], dtype=float32)
Coordinates:
* latitude (latitude) float64 -24.9 -24.9 -24.9 ... -26.0 -26.0 -26.0
* longitude (longitude) float64 30.75 30.75 30.75 ... 32.05 32.05 32.05
spatial_ref int32 4326
time datetime64[ns] 2019-10-19
Attributes:
_FillValue: -32767.0ds.slope.plot()
<matplotlib.collections.QuadMesh at 0x7f40ad75c610>